Integrate data from AXIS Data Insights with Microsoft Power BI™
This guide shows you how to connect data from AXIS Data Insights to Microsoft Power BI™ using API keys and Power Query scripts.
Prerequisites
- AXIS Data Insights: Is a cloud-based service accessible in My Systems. It provides a comprehensive overview of your site’s performance by collecting and processing data from Axis devices and applications.
- Power BI: A Microsoft analytics service for visualizing data and sharing insights.
Generate your connection details in AXIS Data Insights
To connect Power BI to AXIS Data Insights, start by generating an API key and the specific Request URL.
For more details, see Extract data using an API key in the AXIS Data Insights user manual.
Generate API credentials
- Sign in to AXIS Data Insights via MySystems or start a trial here.
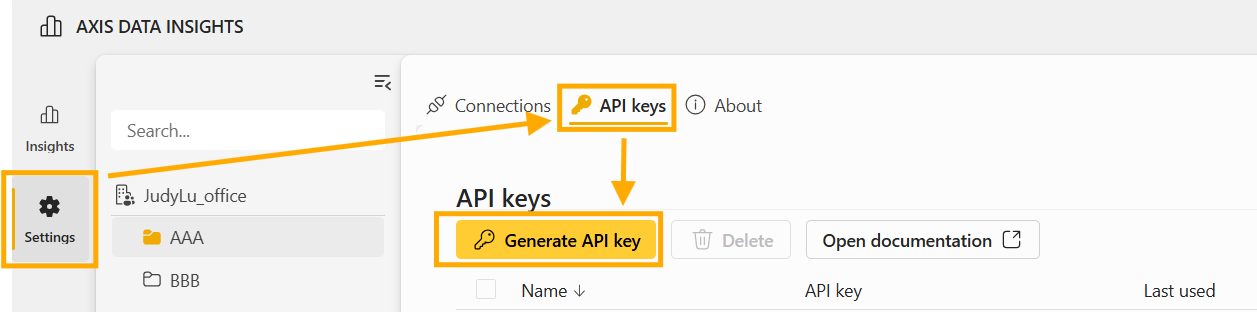
- Go to Settings > API keys.
- Generate an API key if you do not already have a valid one.
Define the data request
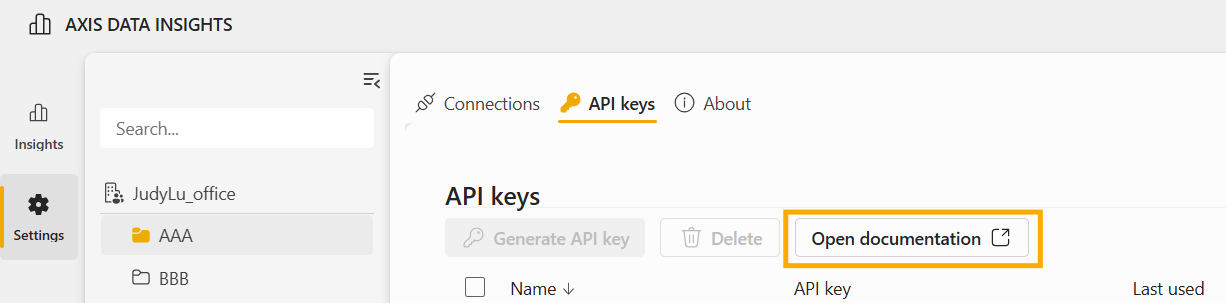
- Click Open documentation tab.
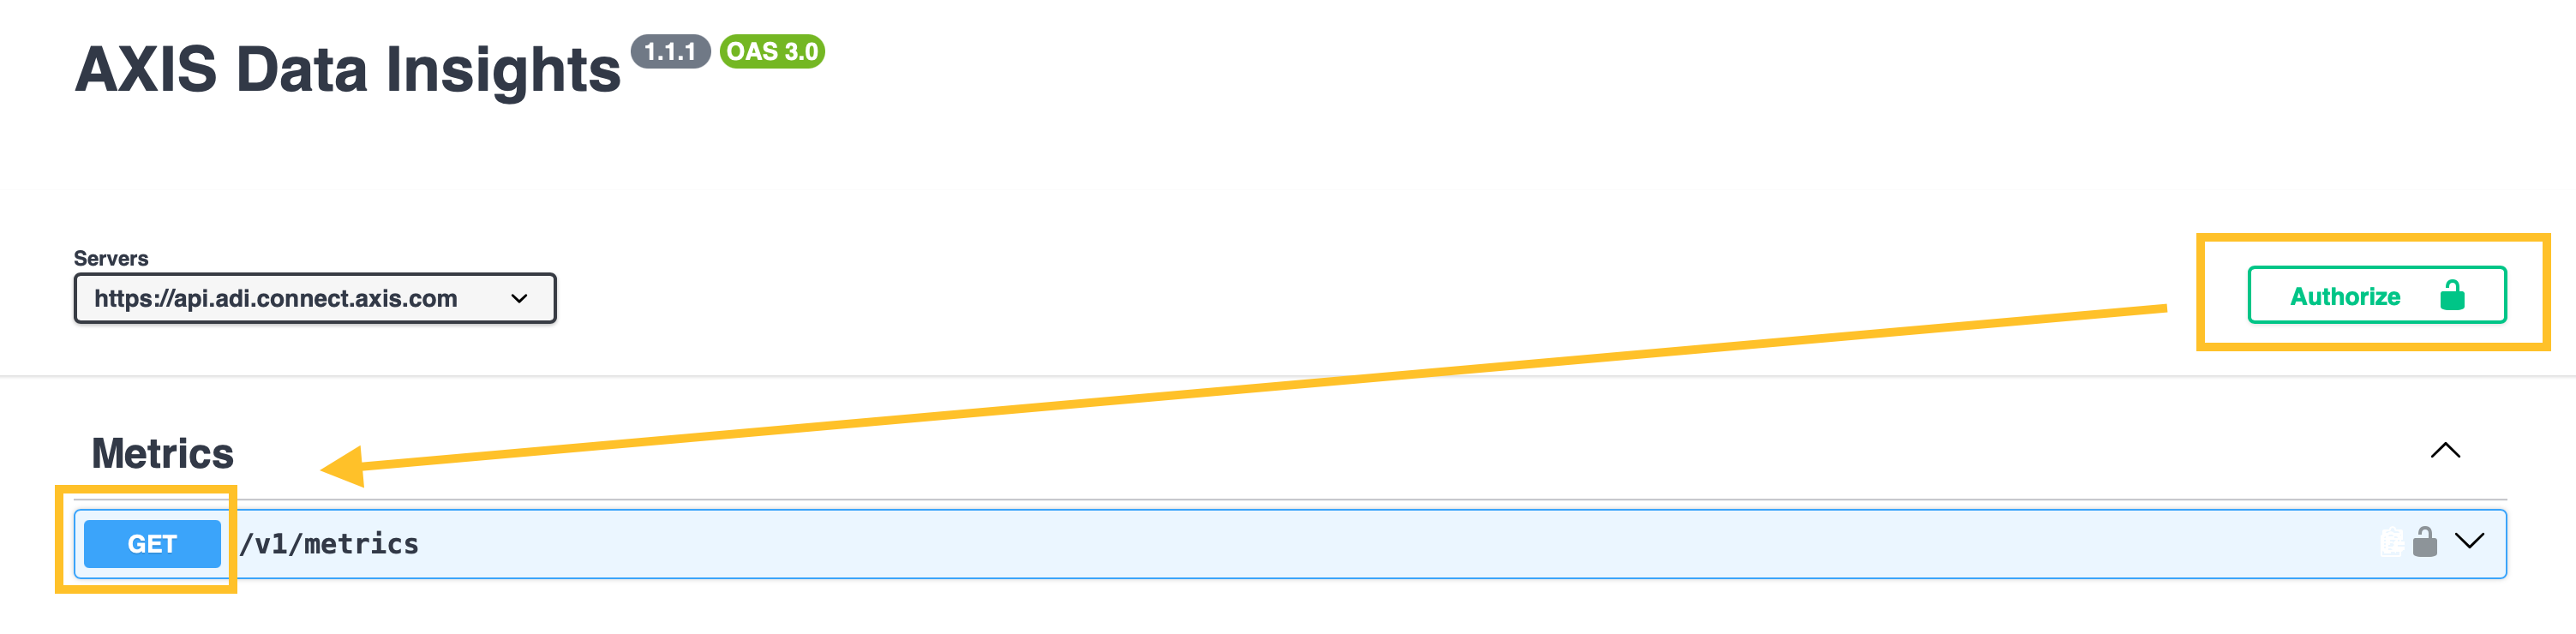
- Enter your API key and organization ID in the authorization dialog.
- Click GET under the Metrics tab.
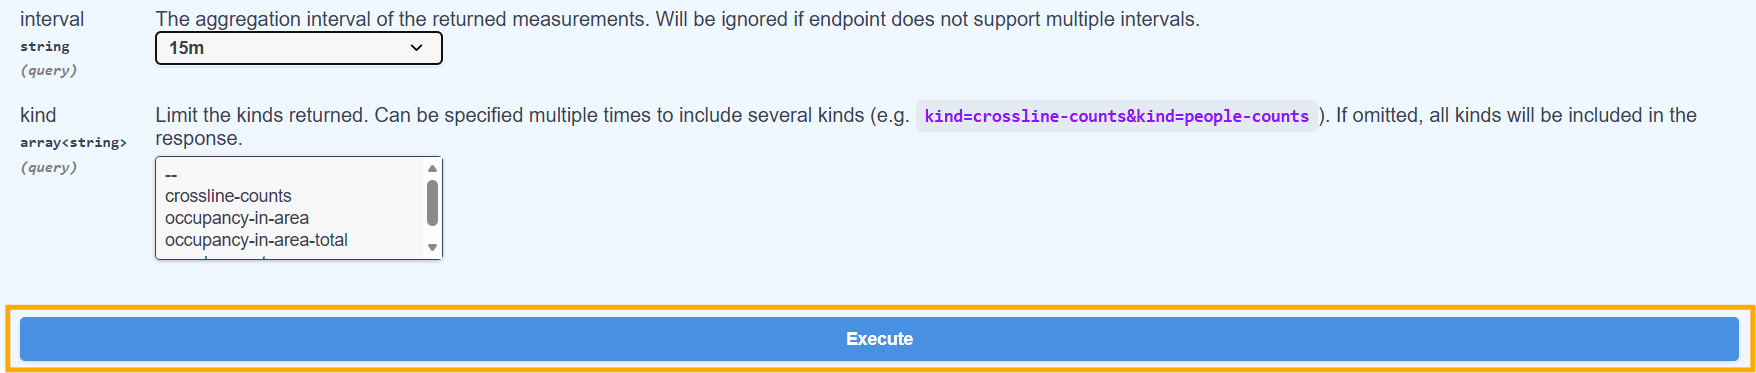
- Specify the information topic you want.
- Click Execute.
Save the connection values
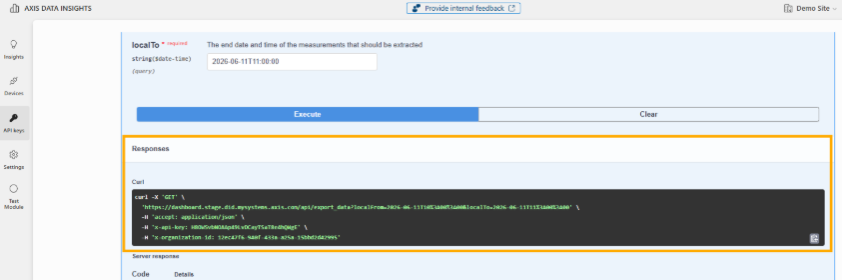
After you select Execute, the server response section shows a curl command. Copy the values from the curl command:
Request URL: The endpoint you call.accept: The response format.x-api-key: Your API key.x-organization-id: Your organization ID.
Connect data in Power BI
To load the data into Power BI, there are two different alternatives:
- Alternative 1: Web import
- Alternative 2: Advanced import.
Alternative 1: Web import
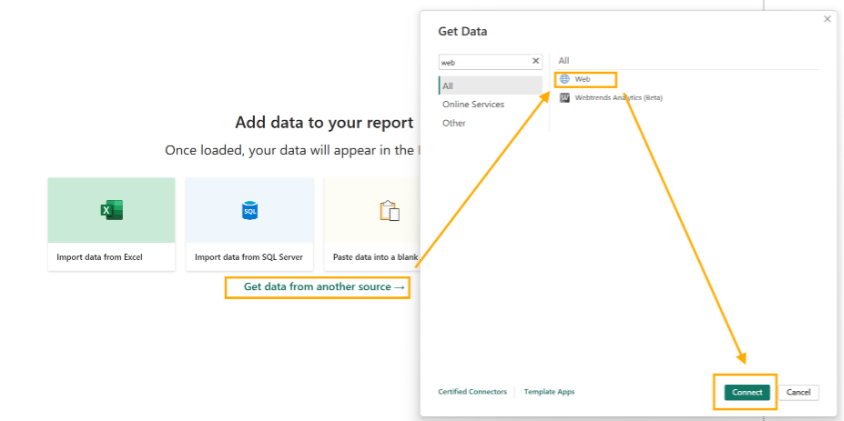
- Open Power BI Desktop.
- Select Get data from another source > Web, then click Connect.
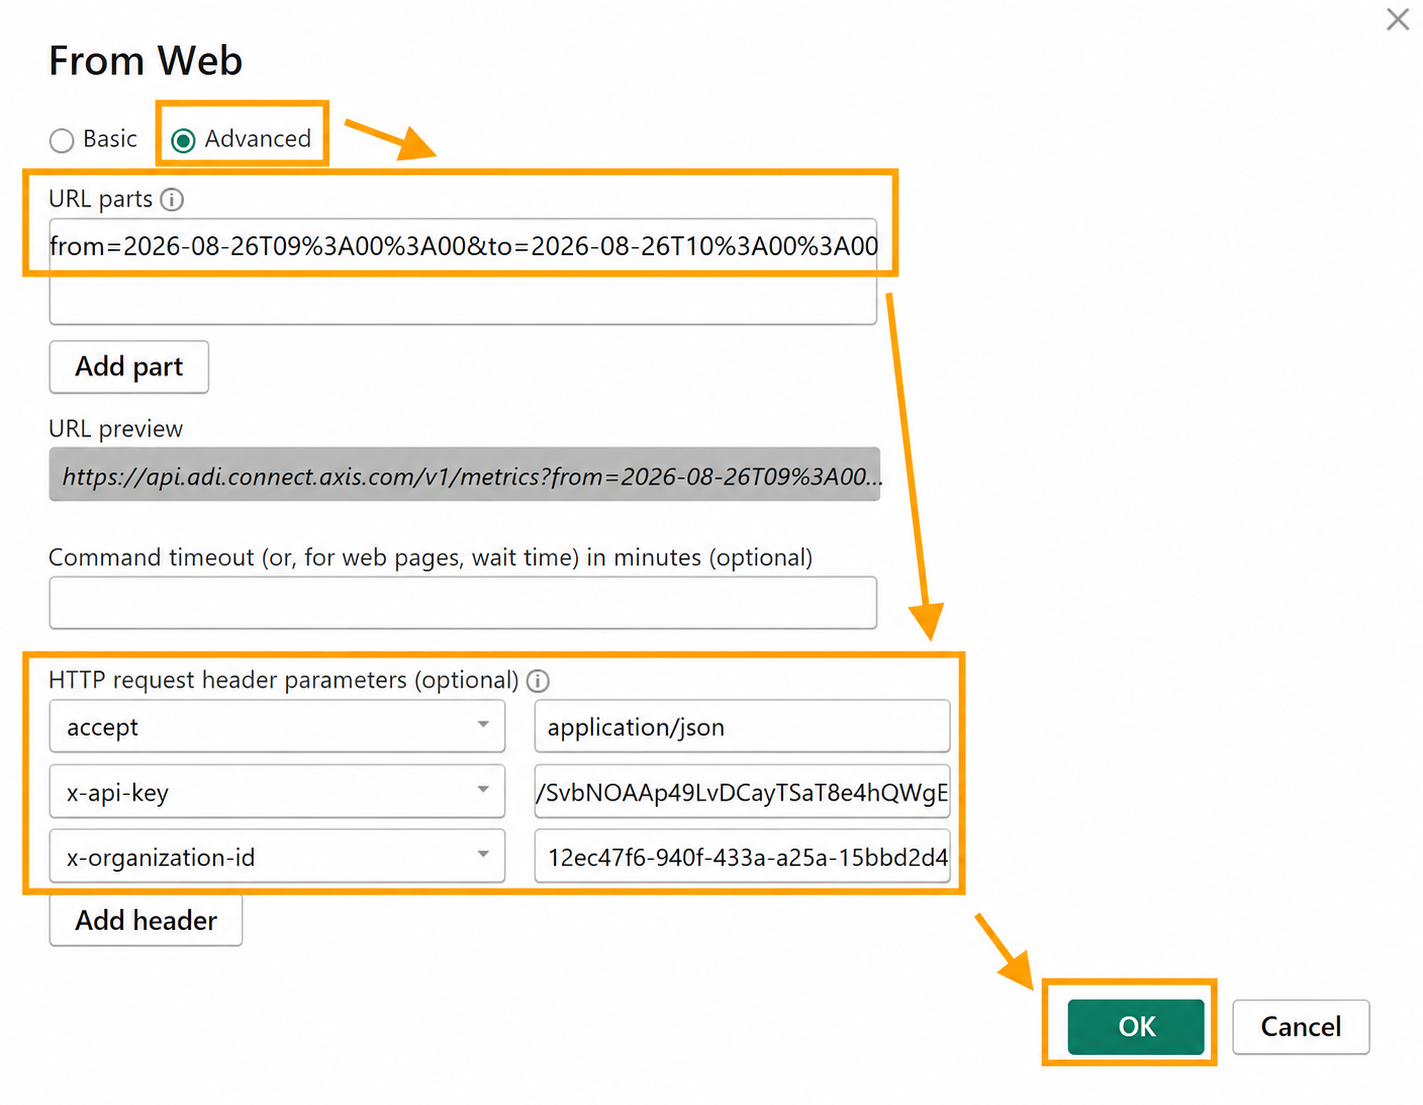
- Select Advanced.
- Enter the URL and headers from the server response copied earlier.
- Select OK.
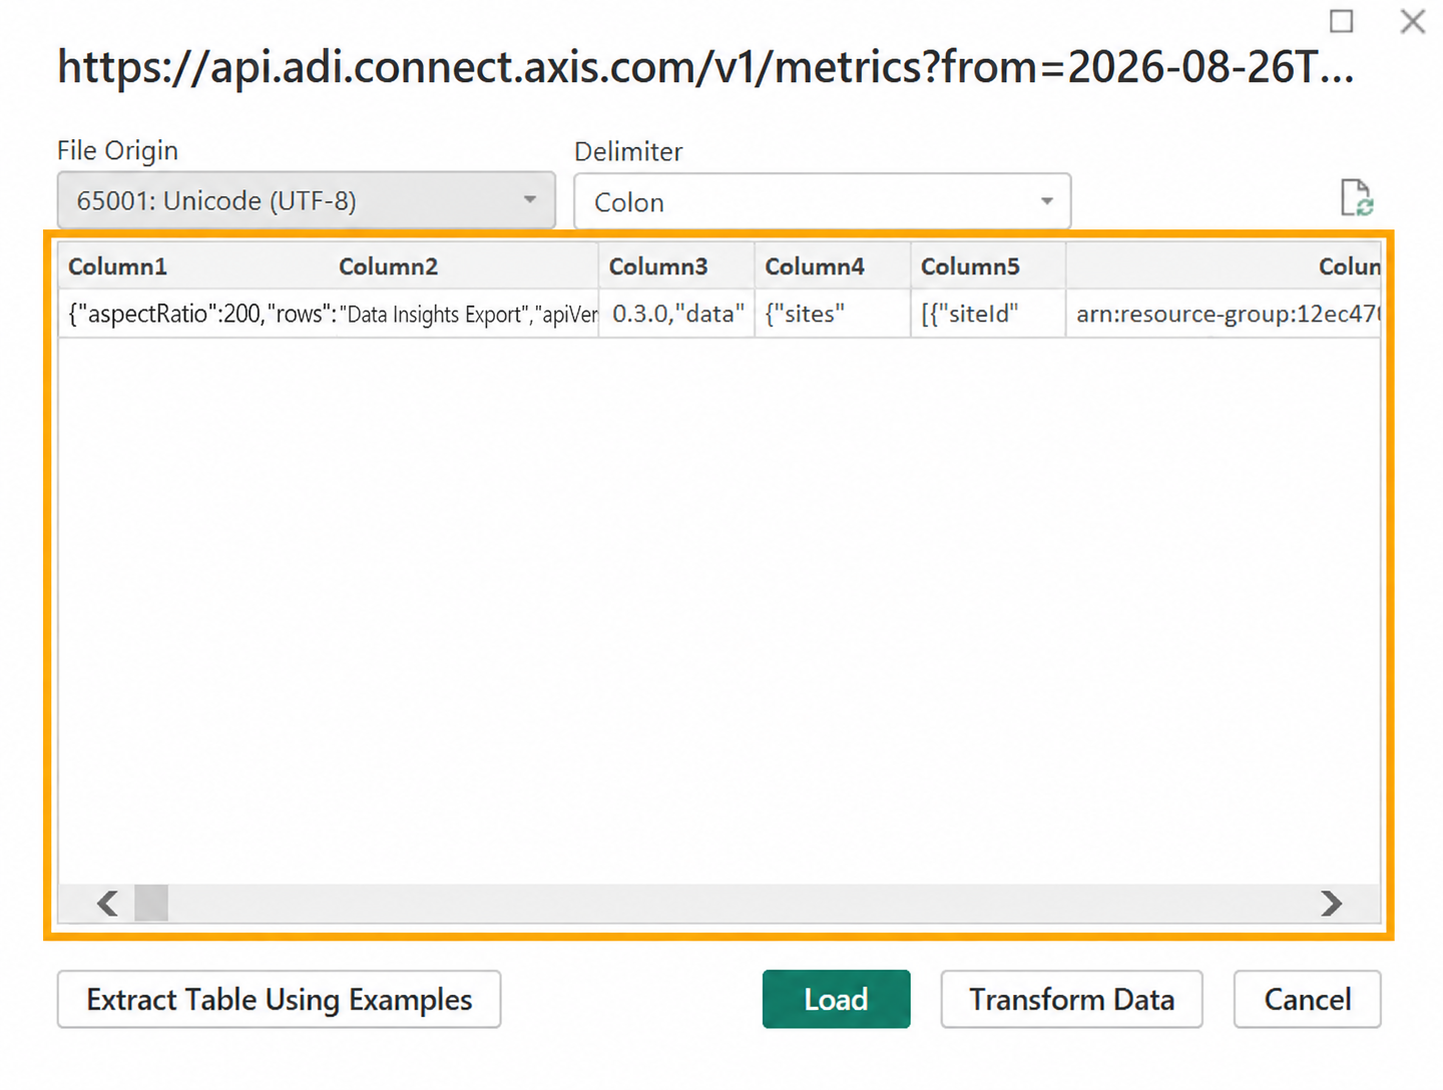
Power BI loads the data so you can transform it or load it directly.
Alternative 2: Advanced import with Blank Query
Use a Blank Query if you want more control of headers and transformations.
- Open Power BI Desktop.
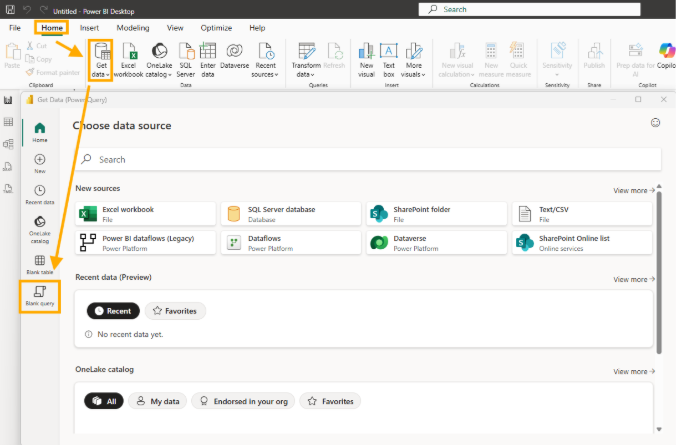
- In the Home ribbon, select Get Data > Blank Query.
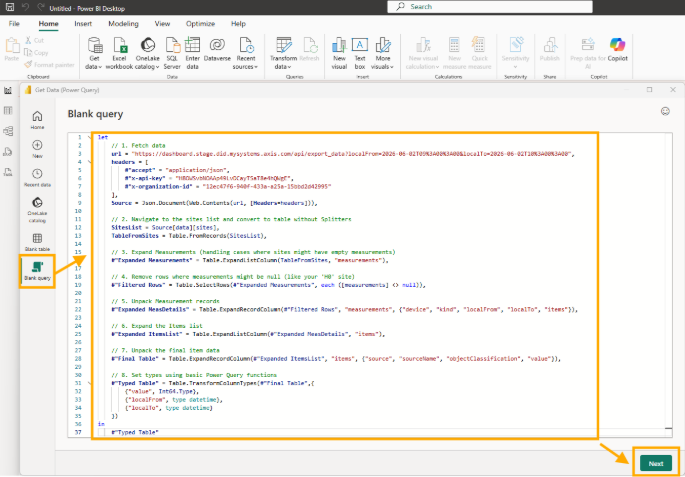
- Copy the integration script example found below and update it with your connection values from the server response copied earlier. Paste your script and select Next.
Integration script example
let
    // 1. Dynamic time generation (rolling 1-hour window for automated refreshes)
    UtcNow = DateTimeZone.UtcNow(),
    ToTime = DateTimeZone.ToText(UtcNow, "yyyy-MM-ddTHH:mm:ss'Z'"),
    FromTime = DateTimeZone.ToText(UtcNow - #duration(0, 1, 0, 0), "yyyy-MM-ddTHH:mm:ss'Z'"),

    // Fetch data using the dynamic URL
    url = "https://api.adi.connect.axis.com/v1/metrics?from=" & FromTime & "&to=" & ToTime,
    headers = [
        #"accept" = "application/json",
        #"x-api-key" = "YOUR_API_KEY_HERE",
        #"x-organization-id" = "YOUR_ORGANIZATION_ID_HERE"
    ],
    Source = Json.Document(Web.Contents(url, [Headers=headers])),

    // 2. Navigate to the sites list and convert to a table without splitters
    SitesList = Source[data][sites],
    TableFromSites = Table.FromRecords(SitesList),

    // 3. Expand measurements
    #"Expanded Measurements" = Table.ExpandListColumn(TableFromSites, "measurements"),

    // 4. Remove rows where measurements might be null
    #"Filtered Rows" = Table.SelectRows(#"Expanded Measurements", each ([measurements] <> null)),

    // 5. Unpack measurement records
    #"Expanded MeasDetails" = Table.ExpandRecordColumn(#"Filtered Rows", "measurements", {"device", "kind", "localFrom", "localTo", "items"}),

    // 6. Expand the items list
    #"Expanded ItemsList" = Table.ExpandListColumn(#"Expanded MeasDetails", "items"),

    // 7. Unpack the final item data
    #"Final Table" = Table.ExpandRecordColumn(#"Expanded ItemsList", "items", {"source", "sourceName", "objectClassification", "value"}),

    // 8. Set types using basic Power Query functions
    #"Typed Table" = Table.TransformColumnTypes(#"Final Table",{
        {"value", Int64.Type},
        {"localFrom", type datetime},
        {"localTo", type datetime}
    })
in
    #"Typed Table"
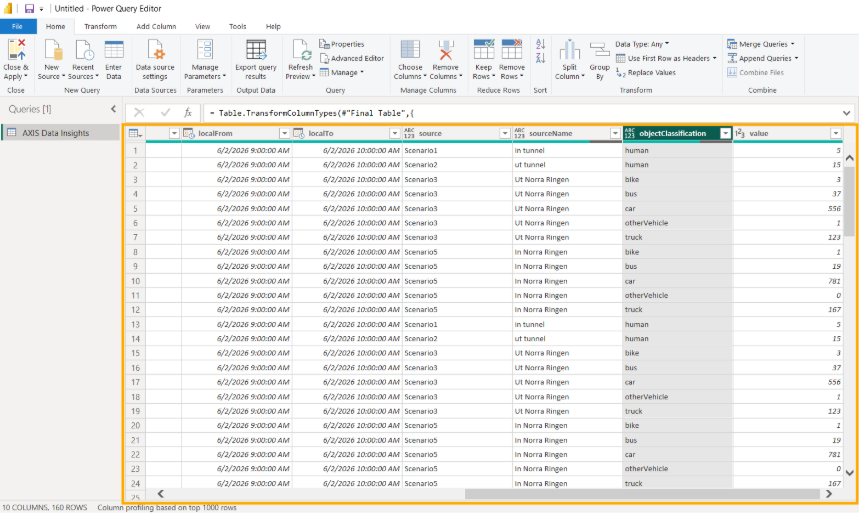
Power BI connects to the cloud service, loads the data, and shows it in a structured table.
Build visuals and automate refresh
After you import data, you can:
- Build visualizations: Use fields to create bar charts, pie charts, and KPIs. For guidance, see Power BI visualization types.
- Automate refresh: Publish your report to Power BI Service and set up Scheduled refresh so your dashboard pulls the latest data. For more information, see Power BI data refresh.
Additional resources
- AXIS Data Insights user manual
- Tutorial: Analyze webpage data by using Power BI Desktop
- AXIS Data Insights API usage guidelines
Microsoft and Power BI are trademarks of the Microsoft group of companies.