AXIS Object Analytics counting data
Introduction
There are a wide variety of use cases and applications for the object counting data produced by AXIS Object Analytics. The following examples are a small fraction of the ways in which this information can be leveraged:
- Gain actionable insights and identify peak traffic hours across different locations
- Quantify and evaluate the impact of measures taken on traffic flow
- Notify personnel when a facility requires maintenance based on usage
- Analyze visitor trends to optimize resource allocation and reduce costs
- Understand the flow of movement and estimate occupancy levels within areas of interest
For more context on the topic, please see Axis For Developers.
Prerequisite
To develop this solution, you will need access to a camera that supports AXIS Object Analytics and the Crossline counting scenario or Occupancy in area scenarios. See compatible products.
Object count event payload
Assuming that you have already configured a Crossline counting or Occupancy in area scenario within AXIS Object Analytics, the scenario will generate a stateless event containing metadata about the object type that was counted. In addition, the Crossline counting event will include the aggregated counts for each of the selected object classes since the time of last reset, while the Occupancy in area event will include the number of objects present within the include area. For information on how to configure these scenarios, please visit the application manual.
Scenarios can be configured via AXIS Object Analytics API
Crossline counting scenario example payload in XML format in event stream sent over RTSP/RTP:
<tt:MetadataStream xmlns:tt="http://www.onvif.org/ver10/schema">
    <tt:Event xmlns:tt="http://www.onvif.org/ver10/schema">
        <wsnt:NotificationMessage
            xmlns:tns1="http://www.onvif.org/ver10/topics"
            xmlns:tnsaxis="http://www.axis.com/2009/event/topics"
            xmlns:wsnt="http://docs.oasis-open.org/wsn/b-2"
            xmlns:wsa5="http://www.w3.org/2005/08/addressing">
            <wsnt:Topic Dialect="http://docs.oasis-open.org/wsn/t-1/TopicExpression/Simple">
                tnsaxis:CameraApplicationPlatform/ObjectAnalytics/Device1Scenario1
            </wsnt:Topic>
            <wsnt:ProducerReference>
                <wsa5:Address>uri://61247186-4e20-4050-ab99-03b8a86ac25a/ProducerReference</wsa5:Address>
            </wsnt:ProducerReference>
            <wsnt:Message>
                <tt:Message UtcTime="2023-01-16T12:46:07.800792Z">
                    <tt:Source />
                    <tt:Data>
                        <tt:SimpleItem Name="scenario" Value="Scenario 1" />
                        <tt:SimpleItem Name="resetTime" Value="2023-01-15T23:00:00Z" />
                        <tt:SimpleItem Name="totalTruck" Value="1258" />
                        <tt:SimpleItem Name="reason" Value="car" />
                        <tt:SimpleItem Name="totalCar" Value="18345" />
                        <tt:SimpleItem Name="total" Value="19723" />
                        <tt:SimpleItem Name="totalOtherVehicle" Value="0" />
                        <tt:SimpleItem Name="totalBus" Value="120" />
                        <tt:SimpleItem Name="totalBike" Value="0" />
                    </tt:Data>
                </tt:Message>
            </wsnt:Message>
        </wsnt:NotificationMessage>
    </tt:Event>
</tt:MetadataStream>
Crossline counting scenario example payload in JSON format sent over MQTT:
{
    "topic": "axis:CameraApplicationPlatform/ObjectAnalytics/Device1Scenario1",
    "timestamp": 1670518346712,
    "serial": "ACCC8EF1E944",
    "message": {
        "source": {},
        "key": {},
        "data": {
            "scenario": "Scenario 1",
            "resetTime": "2022-12-06T22:01:25Z",
            "totalBus": "0",
            "total": "20960",
            "totalTruck": "2857",
            "totalCar": "18103",
            "totalOtherVehicle": "0",
            "reason": "car",
            "totalBike": "0",
            "totalHuman": "0"
        }
    }
}
Description of the metadata fields:
| Field | Description |
|---|---|
topic | Topic specifying the application scenario that produced the event. |
timestamp | Timestamp at which the event was generated. |
serial | MAC address of the device. |
message | A JSON object containing information about the event. |
message.source | N/A |
message.key | N/A |
message.data | A JSON object containing the counting data information. |
message.data.scenario | The name of the scenario that triggered the event. |
message.data.resetTime | Time at which the counting started - e.g. time of last data reset. |
message.data.totalBus | Number of objects of type bus class counted since time of last reset. |
message.data.total | Accumulated number of objects of all classes counted since time of last reset. |
message.data.totalTruck | Accumulated number of objects of type truck class counted since time of last reset. |
message.data.totalOtherVehicle | Accumulated number of objects of type other vehicle class counted since time of last reset. |
message.data.reason | Type of object responsible for triggering the event. |
message.data.totalBike | Accumulated number of objects of type motorcycle/bicycle class counted since time of last reset. |
message.data.totalHuman | Accumulated number of objects of type human class counted since time of last reset. |
The accumulated number of counts can be reset in two ways within the Crossline counting scenario. Manually, by clicking on the "Reset counts" button, or automatically every day at midnight by clicking the "Reset counts at midnight" button. If none of these options are selected, the accumulated number of counts will never reset.
Occupancy in area scenario example payload in XML format in event stream sent over RTSP/RTP:
<tt:MetadataStream xmlns:tt="http://www.onvif.org/ver10/schema">
    <tt:Event xmlns:tt="http://www.onvif.org/ver10/schema">
        <wsnt:NotificationMessage
            xmlns:tns1="http://www.onvif.org/ver10/topics"
            xmlns:tnsaxis="http://www.axis.com/2009/event/topics"
            xmlns:wsnt="http://docs.oasis-open.org/wsn/b-2"
            xmlns:wsa5="http://www.w3.org/2005/08/addressing">
            <wsnt:Topic Dialect="http://docs.oasis-open.org/wsn/t-1/TopicExpression/Simple">
                tnsaxis:CameraApplicationPlatform/ObjectAnalytics/Device1Scenario1
            </wsnt:Topic>
            <wsnt:ProducerReference>
                <wsa5:Address>uri://d36b6220-9ec0-44cf-ac8b-0dbdf0ad9b0a/ProducerReference</wsa5:Address>
            </wsnt:ProducerReference>
            <wsnt:Message>
                <tt:Message UtcTime="2023-05-29T08:37:58.199601Z">
                    <tt:Source />
                    <tt:Data>
                        <tt:SimpleItem Name="scenario" Value="Scenario 1" />
                        <tt:SimpleItem Name="bike" Value="0" />
                        <tt:SimpleItem Name="bus" Value="1" />
                        <tt:SimpleItem Name="human" Value="0" />
                        <tt:SimpleItem Name="total" Value="5" />
                        <tt:SimpleItem Name="truck" Value="1" />
                        <tt:SimpleItem Name="otherVehicle" Value="0" />
                        <tt:SimpleItem Name="car" Value="3" />
                    </tt:Data>
                </tt:Message>
            </wsnt:Message>
        </wsnt:NotificationMessage>
    </tt:Event>
</tt:MetadataStream>
Occupancy in area example payload in JSON format scenario sent over MQTT:
{
    "topic": "axis:CameraApplicationPlatform/ObjectAnalytics/Device1Scenario1",
    "timestamp": 1685349977783,
    "message": {
        "source": {},
        "key": {},
        "data": {
            "scenario": "Scenario 1",
            "bus": "0",
            "total": "21",
            "bike": "0",
            "car": "21",
            "otherVehicle": "0",
            "truck": "0",
            "human": "0"
        }
    }
}
Description of the metadata fields:
| Field | Description |
|---|---|
topic | Topic specifying the application scenario that produced the event. |
timestamp | Timestamp at which the event was generated. |
serial | MAC address of the device. |
message | A JSON object containing information about the event. |
message.source | N/A |
message.key | N/A |
message.data | A JSON object containing the counting data information. |
message.data.scenario | The name of the scenario that triggered the event. |
message.data.bus | Number of objects of type bus class present within the include area. |
message.data.total | Total number of objects present within the include area. |
message.data.truck | Number of objects of type truck class present within the include area. |
message.data.otherVehicle | Number of objects of type other vehicle class present within the include area. |
message.data.bike | Number of objects of type motorcycle/bicycle class present within the include area. |
message.data.human | Number of objects of type human class present within the include area. |
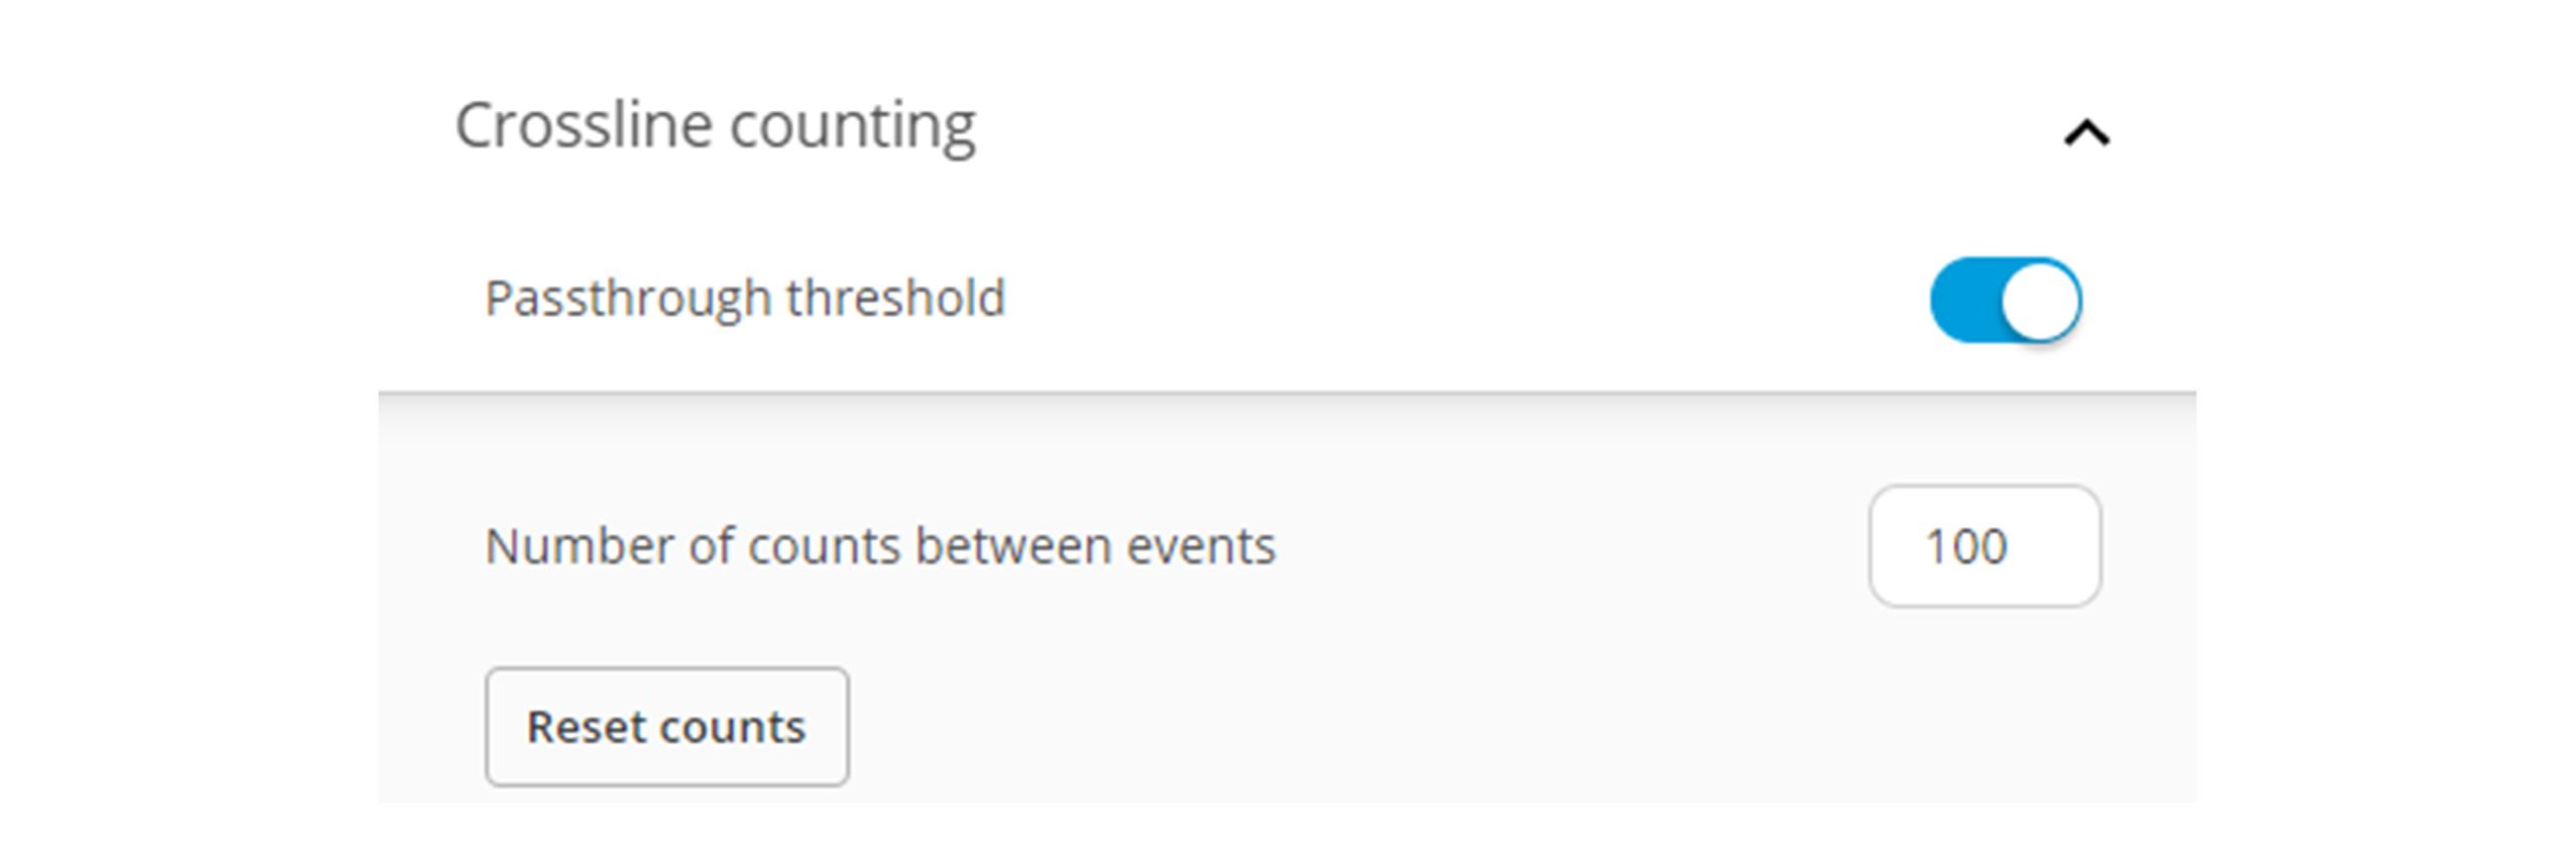
Passthrough threshold event
If the Passthrough threshold feature has been configured, the Crossline counting scenario will also generate a stateless event whenever the number of objects exceeds the amount specified within the application. This event does not contain metadata about the classified objects and is primarily used to alert staff or operators to take action when this condition is met. For example, within facility management to perform maintenance when 100 people have been counted.
Subscribe to the event stream
The object counting metadata can be accessed using two methods, further described in this chapter.
Event data streaming
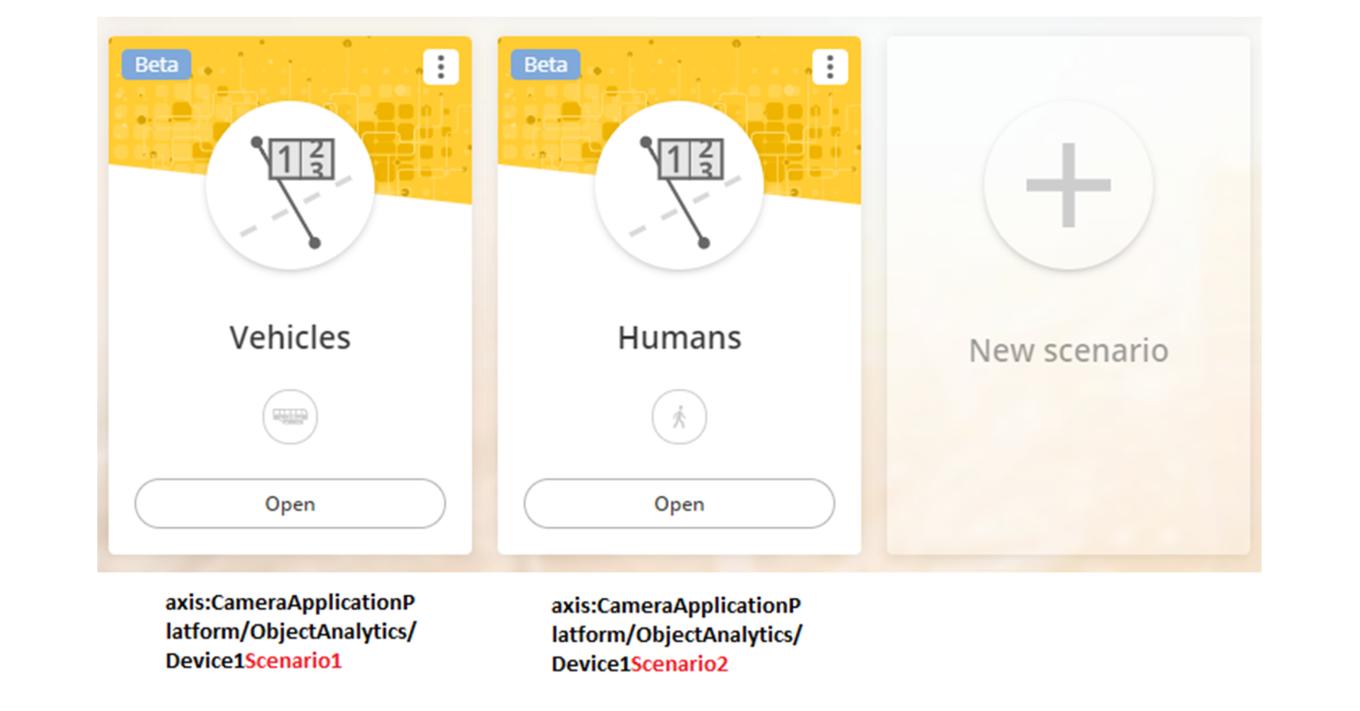
The event topic axis:CameraApplicationPlatform/ObjectAnalytics/Device1Scenario1 should be used to subscribe to the specific events generated by the Crossline counting scenario. The scenario number used in the event topic needs to match the Crossline counting scenario number that has been configured within AXIS Object Analytics. So, Scenario1 in the event topic corresponds to the first Crossline counting scenario configured in AXIS Object Analytics and Scenario2 would correspond to the second one. Please see an example below. Other scenarios such as Object in area or Line crossing will not contain the object count metadata described in the previous section.
A client may receive event notifications by subscribing to specific events in the stream. The event stream is sent over RTSP/RTP. Events emitted by Axis products are in XML format and follows the ONVIF standard. Please visit the Event data streaming which describes how to query the Axis product for supported events, how to subscribe to the event stream and how to interpret the response.
To avoid overloading the Axis product, only subscribe to the events interesting to the client or application. Do not subscribe to more events than necessary. Event subscriptions start internal services in the Axis product and may cause performance problems.
MQTT
- The MQTT client in AXIS OS can simplify integration of data and events produced in the device to systems that are not video management software (VMS). Using the Crossline counting or Occupancy in area scenario as a trigger condition within an MQTT publish event allows subscribed clients to receive the object count metadata included in the payload of each event generated. This guide does not provide an overview of the MQTT protocol or specific configuration of the MQTT client on the camera. To find out more about these topics, please visit Device integration with MQTT and VAPIX® MQTT Client API.
Start implementing
You now possess the necessary information to develop a solution that enables visualization of the counting data produced by the Crossline counting scenario. As previously alluded to, the components making up such a solution can vary drastically depending on the specific needs of your project. In most cases, the data will be stored in a database type component which can be queried regularly to extract the data of interest and visually present it in graphs or dashboards. In other cases, however, the database component might not be required if there is a need to present the data in as close to real-time as possible.
Example implementation
AXIS Object Analytics visualization using Grafana® dashboard is using MQTT as a secure transport protocol from the camera to Amazon Web Services (AWS). AWS IoT Core (MQTT broker) receives the MQTT messages from the camera and forwards them to a time-series database (Amazon Timestream) for storage and further processing. A local or cloud instance of Grafana is connected to the Amazon Timestream database, which queries the data and displays it visually in graphs and tables.
Other resources
You can also find information about the configuration steps required to connect an Axis device to other widely available MQTT brokers by visiting the links below: